Imagenet Data Insights with VGG16

Project Notes
Curious how it works? Try the demo and play with the layers and samples. (Works best on a desktop!) If you want I can give you a free private tour too!
Originally an assignment for the Data Visualization For And With AI course supervised by Prof. Jefrey Lijffijt, which I intentionally overbuilt. Beyond the original requirements, I used this as a personal research sandbox to explore model interpretability and high-performance deployment.
This is primarily a proof of concept rather than a long-term project.
Introduction
For this project I built an interactive Dash dashboard around VGG16 trained on ImageNet. The idea is to make the model less of a black box by exposing its internal representations in a visual way.
To do that, I designed a highly interactive Dash app that lets you explore the model layer-by-layer, inspect how data flows through it, and discover structure in the ImageNet subsets through dimensionality reduction.
What you can do
The dashboard enables a wide range of model- and data-centric exploration tasks:
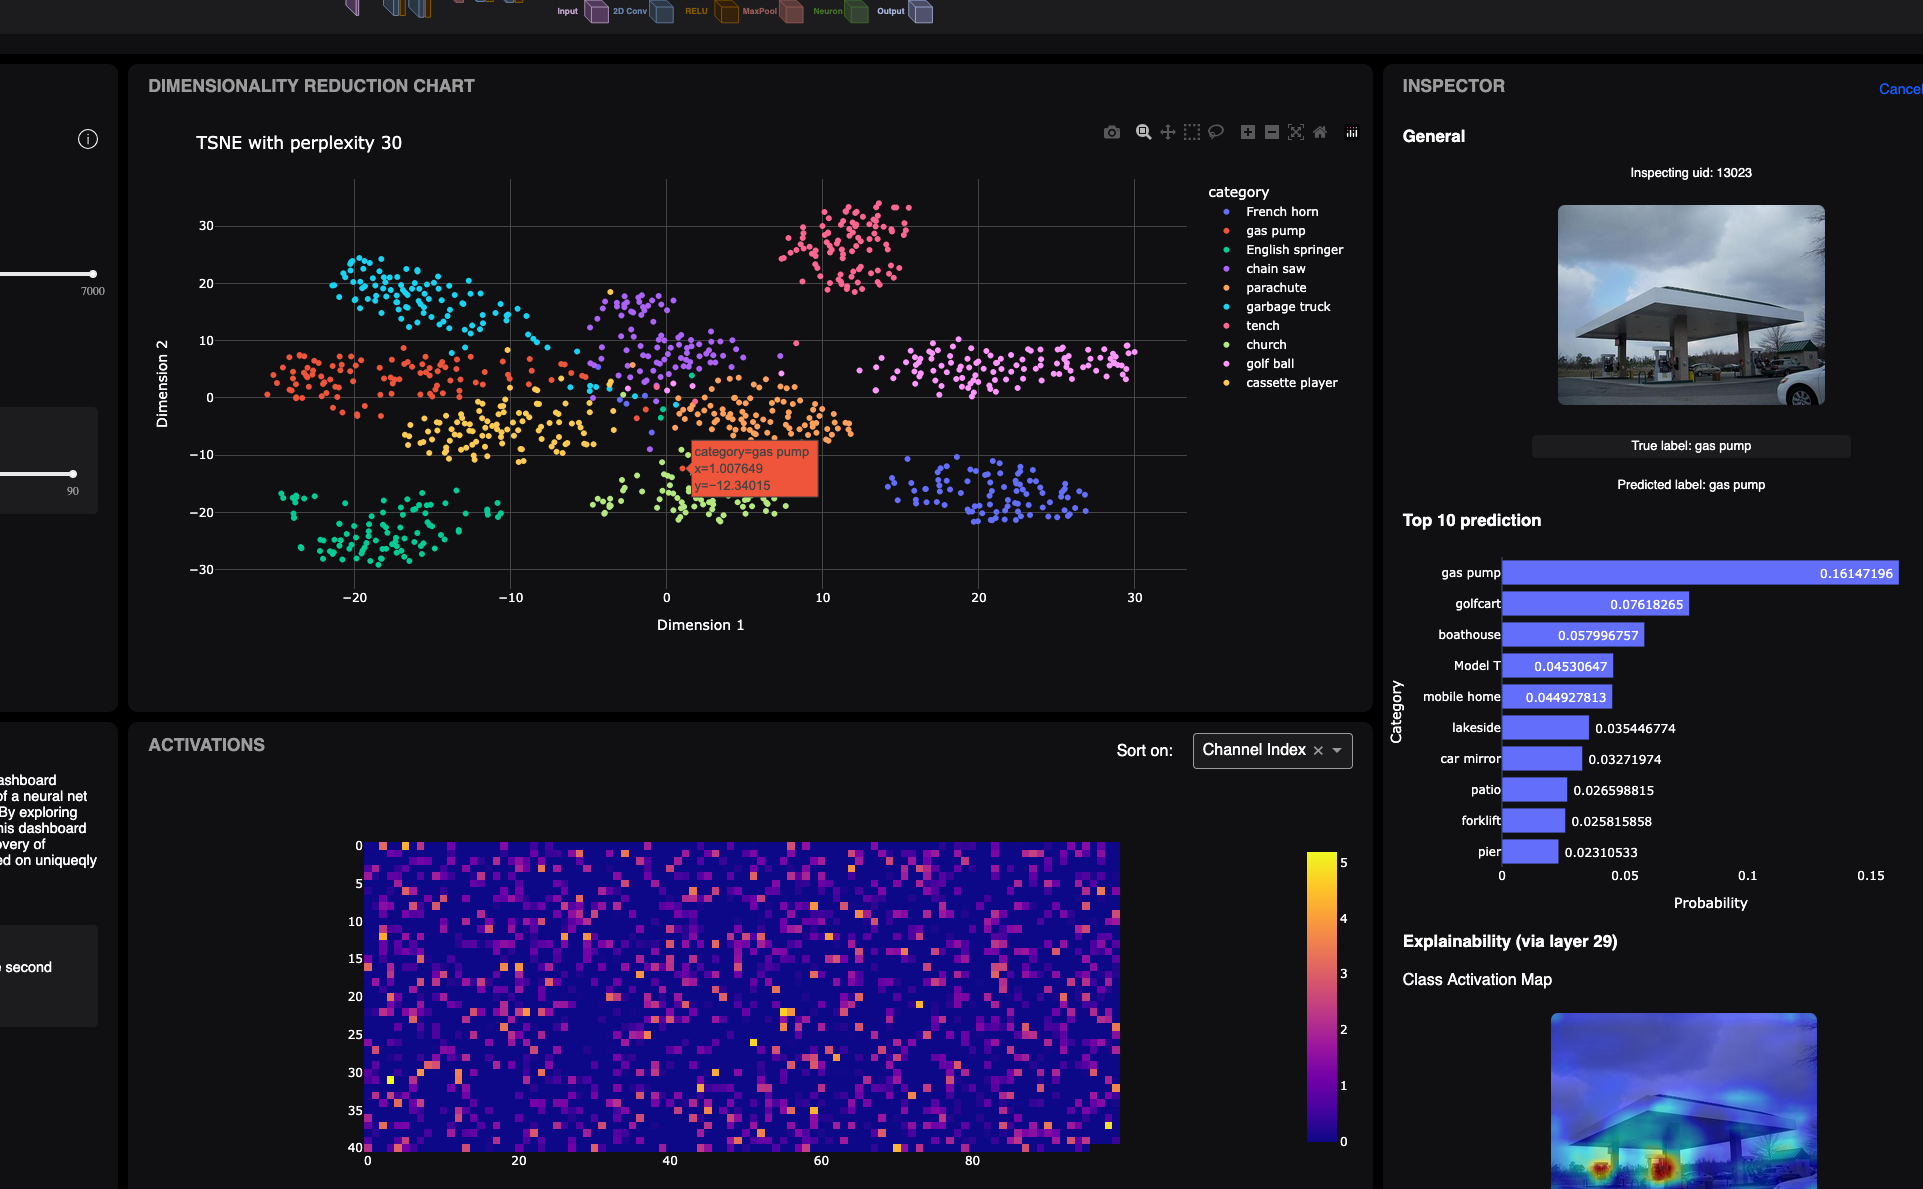
- Browse a visual model map: Select any layer of VGG16 by clicking directly on an isometric model visualization, giving an immediate sense of where you are in the network.
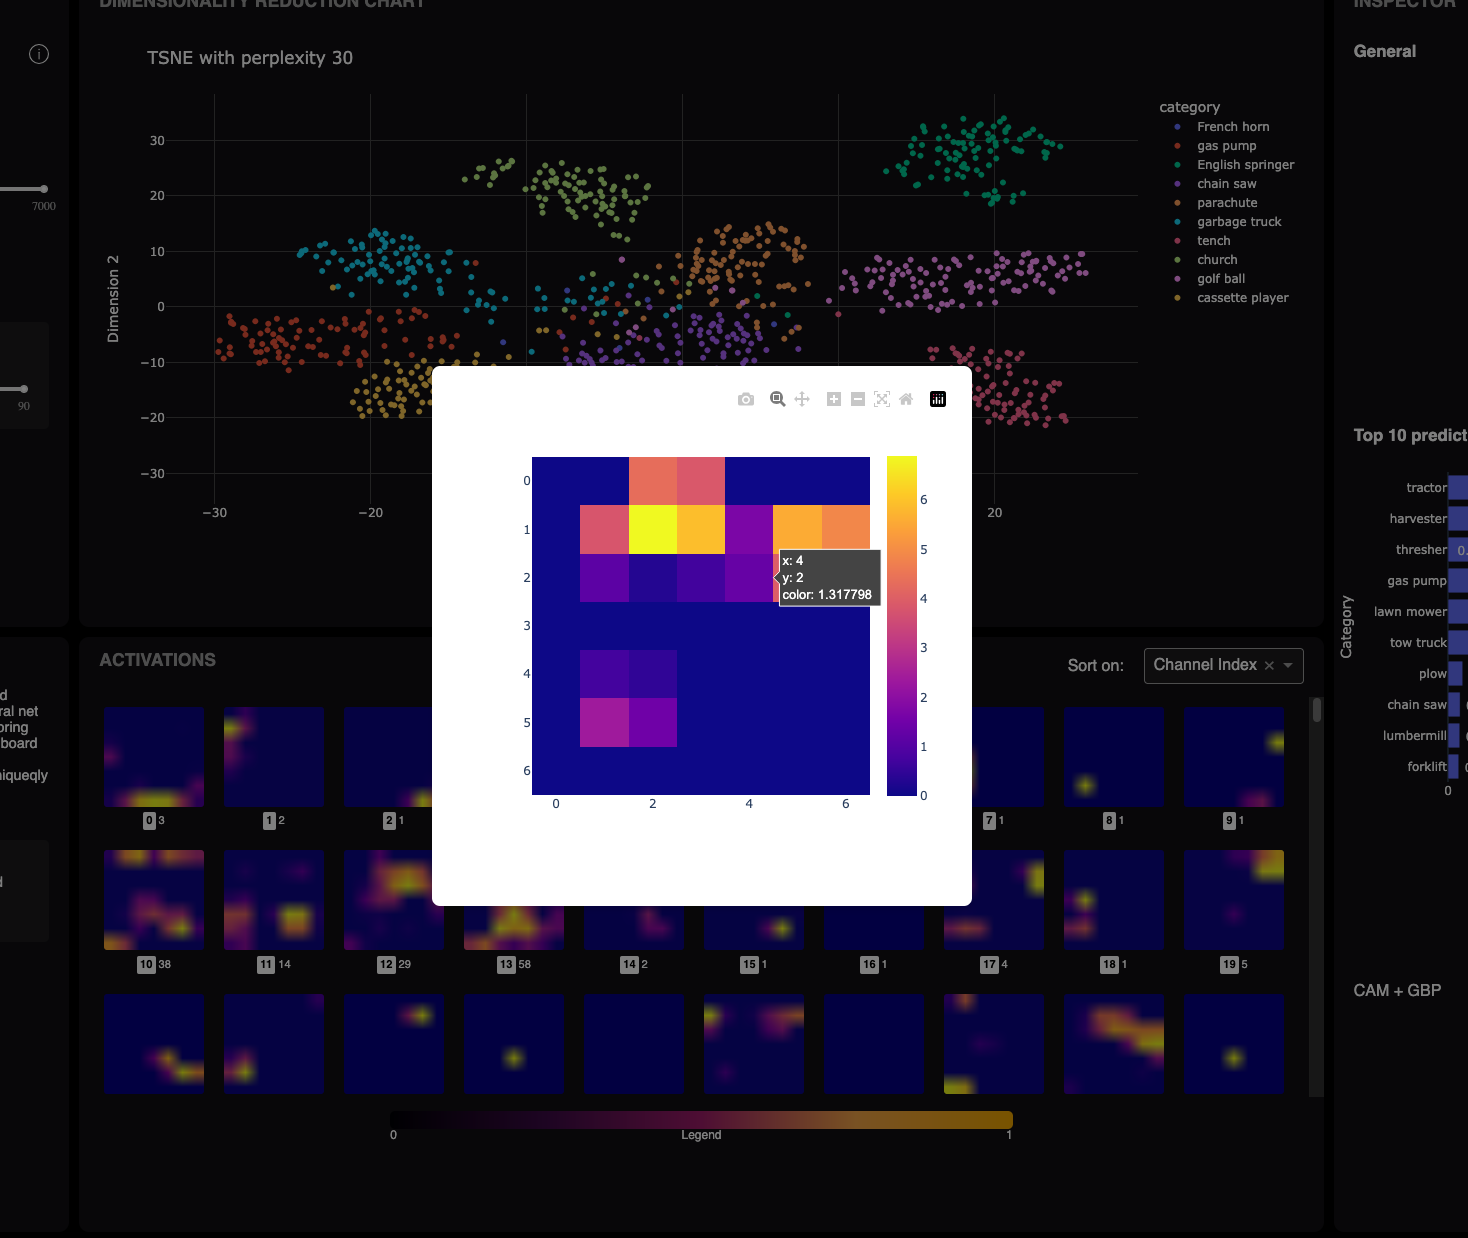
- Explore data structure: Run PCA or t-SNE on ImageNet subsets either on the raw data or on activations from any layer—to reveal clusters and shared features between samples.
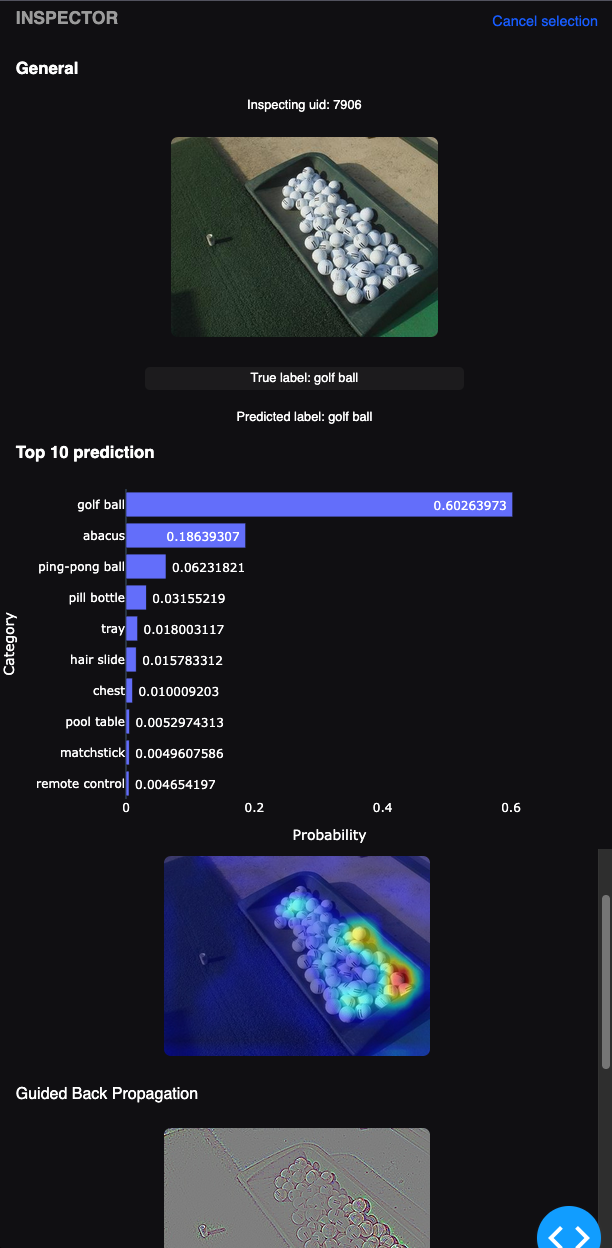
- Inspect samples interactively: Hover or click to view the image, the top-10 predictions, and multiple XAI explanations (CAM, Guided Backprop, combined overlays).
- Dive into activations: Open full activation grids for convolutional layers, ranked by a custom entropy-based score to surface interesting channel behaviors. Zoom in to neuron-level detail through modal heatmaps.
- Experiment with settings: Swap between ImageNet subsets, sample counts, dimensionality-reduction methods, and perplexity values to see how representations shift.
Ultimately, the dashboard provides a hands-on way to understand how large CNNs process images, moving from dataset-level structure, to layer-wise embeddings, all the way down to individual neuron activations.
Interesting Findings
While exploring the dashboard, a few patterns became very clear. One of the most interesting was how the t-SNE embeddings evolve as you move deeper into VGG16. Early layers focus on low-level texture and color, so the projections look scattered and somewhat noisy. In contrast, the later layers begin to form clear and stable clusters. By the final convolutional blocks and the dense layers, samples with shared semantic properties naturally group together.
You can literally see the representation space becoming more structured as the network processes the image. Some classes also cluster together because they share mid-level features, not necessarily semantics, which becomes obvious only when switching between layer depths. The dashboard made these transitions very easy to observe.
Handling High-Dimensional Layers
The early layers of VGG16 produce extremely high-dimensional activations. For example, the first convolutional layer outputs a feature map of 224 × 224 × 64, which is more than three million dimensions per sample. Applying t-SNE directly to this is not feasible.
To address this, I used a small hierarchical reduction pipeline:
- Spatially downsample the 2D feature maps.
- Apply PCA while retaining about 90% of the variance.
- Apply t-SNE or PCA to reach two dimensions.
This reduces the data to a size that is workable for interactive exploration while still preserving the important structure of each layer. After this pipeline, early layers end up in the range of a few hundred to a bit over a thousand dimensions instead of several million. This approach made dimensionality reduction across all layers practical inside the dashboard.